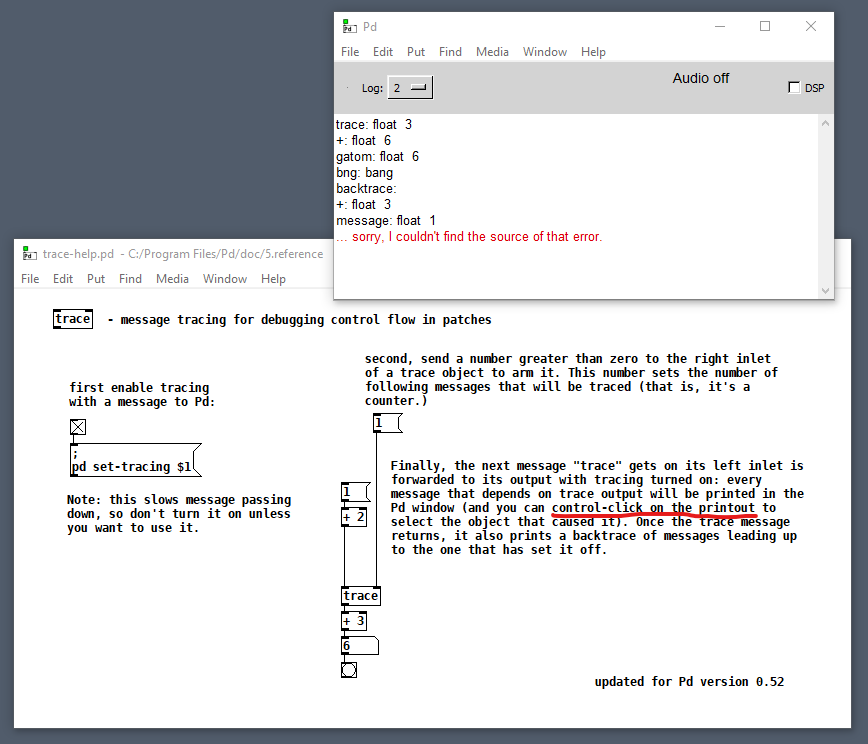
Has anyone gotten the ctrl-click feature of [trace] to work on Windows 10? I get the same apology no matter what I ctrl-click.

[trace] on Windows 10
Has anyone gotten the ctrl-click feature of [trace] to work on Windows 10? I get the same apology no matter what I ctrl-click.

@jameslo It looks to me as though it worked and has listed the complete traces.
I don't know what error it thinks it is looking for.
Maybe the message in red simply means that the task is completed.
It doesn't surprise me that you always get the same message if there is no error.
Have you tried for example........
[all(
|
[select all]
......to see what it decides to report?
David.
@whale-av In the test you're proposing, where would [trace] be inserted?
I think I described the issue too tersely. The trace output in the console window is fine, but I'm talking about the feature where you can control click on any of the trace lines and it selects the object that caused it. Any trace line I ctrl-click results in "... sorry, I couldn't find the source of that error." being output in the console window, and nothing is selected.
Update: On MacOS 10.14.6, when I command-click on a trace line, the corresponding object is selected and the containing window is put into edit mode. That's what I was expecting.
@jameslo It works as you expect in Windows 7 pd 0.52.1.
No help I know, but maybe a bug in pd under Widows 10?
If [trace] is recognised by windows as a debugger (seems unlikely to me.... probably just a normal Pd process) then maybe it is blocked in the group policy.
You could check.....
Group Policy Management Editor -> Windows Settings -> Security Settings -> Local Policies -> User Rights Assignment -> Debug programs -> Define these policy settings:
David.
@whale-av Nah, if I run Pd as administrator I get the same error (administrator is granted debug privileges by default on my machine).
I still miss Windows 7. Nothing gold can stay.
FWIW the commit in the source repository says "add experimental message tracing feature" -- "experimental" I take to mean "may still have bugs" so it's probably a good idea to report this as a bug in the github bug tracker.
hjh
Oops! Looks like something went wrong!