I've never really dug into pitch shifting before and I have started looking at Miller's pitch shifting patch example from his book but I'm a little confused by the graph in this related example, specifically Fig 7. 17. (I think just because how the qualifying text is worded). I have a few clarifying questions so hopefully someone can humor me.
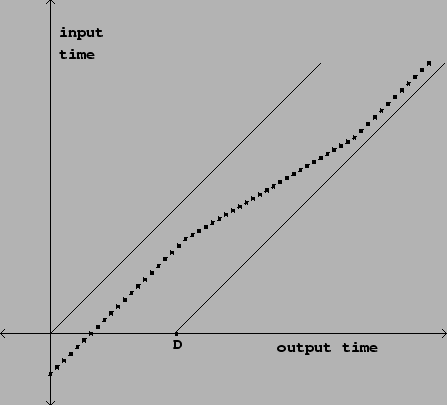
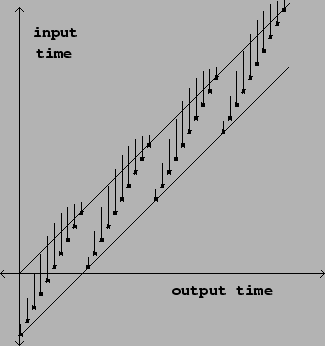
- The diagonal line from origin (0,0) is the input signal; the dotted line is the variable delay line; the diagonal line at D is the delay line over time relative to the input signal, yes?
- D is the distance from the origin point to the point marked D on the x axis, correct? This is the max length of the delay line?
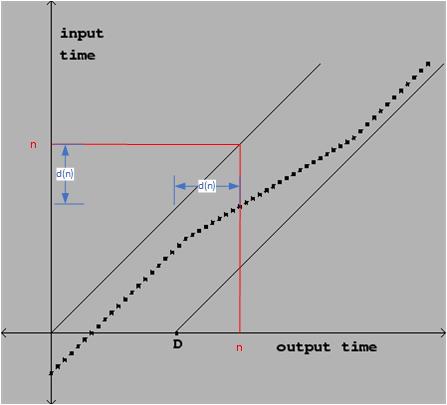
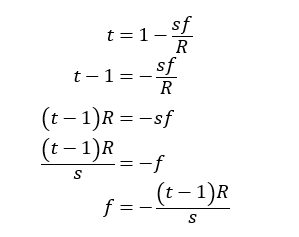
- The y axis shows the quantity
n - d[n]whered[n]represents the delay in samples and this is where I get a bit fuzzy: graphically, what is the output sample here? Why am I subtracting? What am I subtracting?
Thanks in advance!


") The parallel line description is precisely where I had arrived when reading through this material, so thanks for confirming. I have some follow-ups so hopefully you're game to keep the conversation going. I am looking at the
The parallel line description is precisely where I had arrived when reading through this material, so thanks for confirming. I have some follow-ups so hopefully you're game to keep the conversation going. I am looking at the