Hi PD,
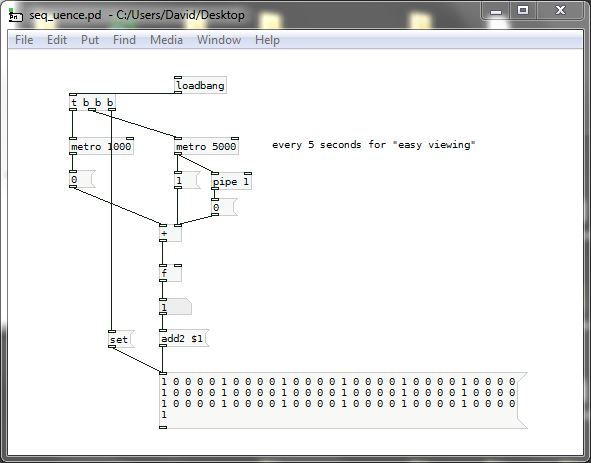
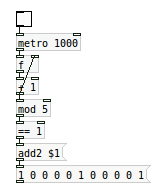
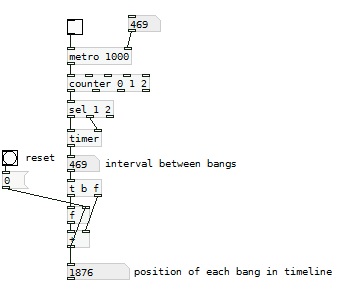
I'd like to plot metro's output using textfile object in a way that the result shows the bangs as 1's and all the other "output", if any, as 0's. This way I can visualize the temporal distribution of the bangs over a test period.
However, metro only outputs bangs on the "1"s and otherwise outputs nothing, so I can't figure out how to achieve my goal.
I wonder if there is a standard way of doing what I want.
Thanks!

