in tried to implement three shaders that could be useful with pure data.
the shaders are not my work, but i had to adapt and to learn a lot to make them work with pure data.
would be nice to improve them further.
i put the links from the shaders as comments into the frag. files.
ofelia_conway_sonogram_vectorscope.zip
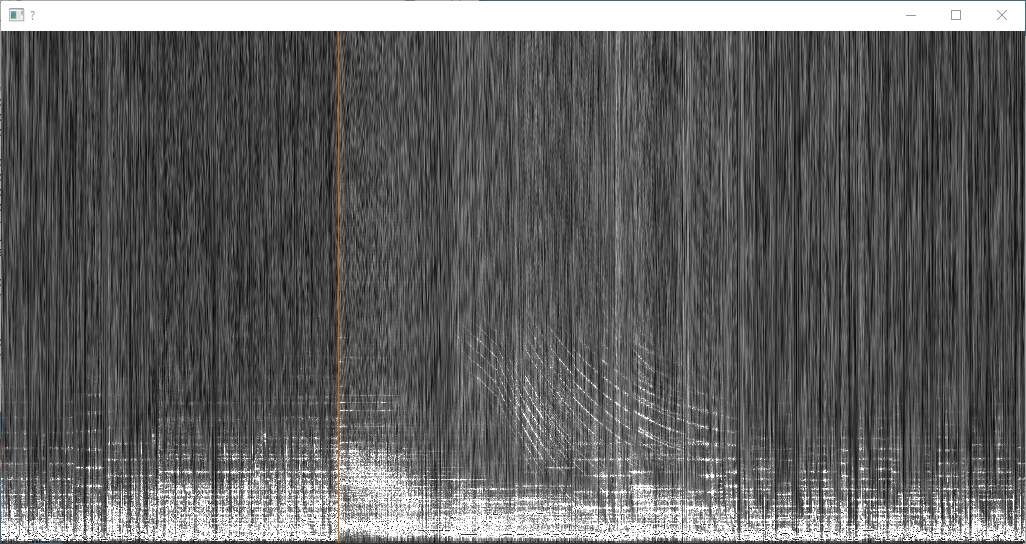
the spectrogram works quite well, but i do not know if i implemented the best fft algorithm for that case / and in the right way...).

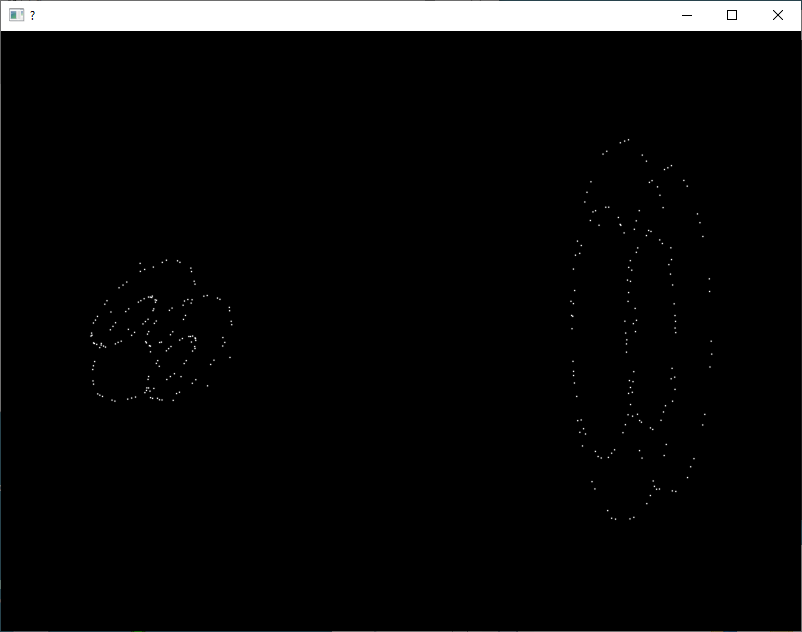
the vectorscope is quite gpu expensive. from the comment:
"GLSL is the absolutely worst medium for rendering this,
but Shadertoy seemed like a good place to find people who
might have ideas about this.
On the left is a return diagram. It is an X-Y plot of a
function against itself at a constant offset. The offset is
a tunable parameter. If it is set to one fourth of the
period of a certain frequency, then waves at that frequency
will cause the diagram to draw circles. Other frequencies
will cause some kind of ellipses.
On the right is a phase space diagram of the signal. It is
an X-Y plot of the signal against its differential. The
scaling factor applied to the differential is a sort of
tunable paramater too, which again allows you to choose one
frequency to form perfect circles.
These both draw kind of neat patterns, but not really neat
enough to work as visualization. How could this be improved?
(You'd probably have to do it in something other than a single
shader, though, to be able to draw more points, or lines.
Having access to more of the signal might also be a good thing.)"

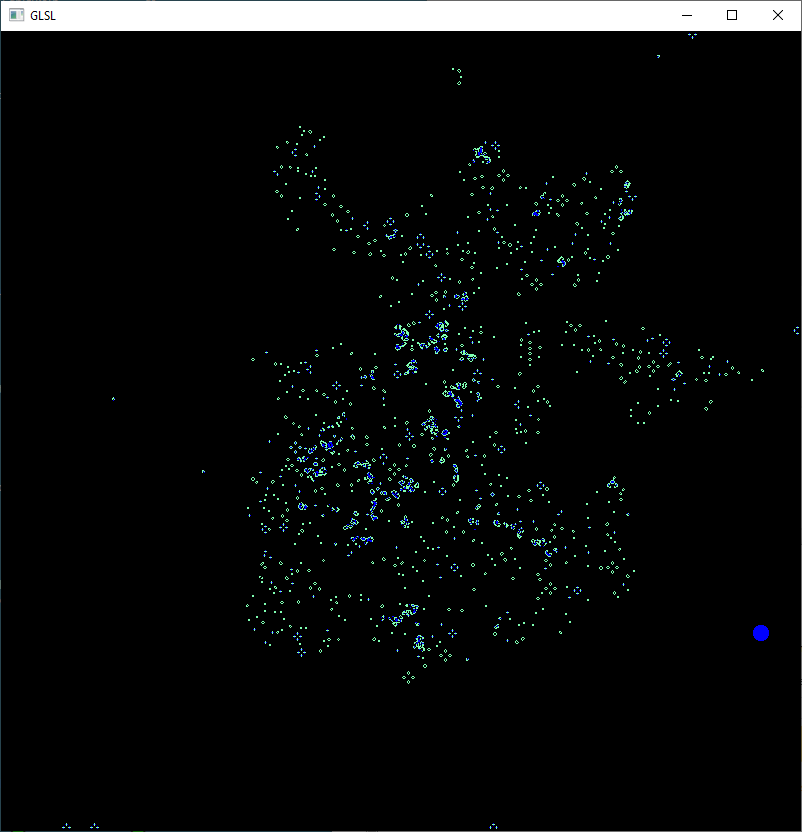
The conway shader works good, but i do not understand it enough to change the rules or even the size of the cells...


