In a table-array 100x100 dots plotted.
Top left 0/0
Lower right 100/100
how does it work?
Thank you.
Greeting
In a table-array 100x100 dots plotted.
In a table-array 100x100 dots plotted.
Top left 0/0
Lower right 100/100
how does it work?
Thank you.
Greeting
Hello thanks for the demo.
I want to put all 10000 points in the array.
Thank you.
greeting
@funkheld ?...... like this.......

It can't be done with an array (a Pd table array that is) as each value is given an index, and if you write to the index with a different value it drops the old value. I think you would have to use Gem (writing individual pixels) if you want to view the array.
Or you could make a grid of 100x100 canvases, and send messages to them to change their colours.
If you don't want or need to see the result then you could use a matrix, that could be printed to the terminal or a text file........
The iemmatrix library which is included in Pd Extended can probably be imported to Vanilla through the Deken Plugin....... and contains [matrix-help].....
matrix.zip ..... shows what can be done, but might not work without the complete library.......
David.
error: test.mtx: can't open
error: matrix: failed to read test.mtx
Hello, thanks for the help.
Where to get the file test.mtx?
Thank you.
greeting
@funkheld No, sorry, I don't know.
If it looks like what you are looking for then you probably need the complete iemmatrix library and maybe some other libraries as well.
The easiest way....... http://puredata.info/downloads/pd-extended
The middle way..... use Deken (in Pd 0.47.1 go to "help" menu.... "Find Externals")
Probably the hardest....... https://git.iem.at/pd/iemmatrix or
https://github.com/iem-projects/pd-iemmatrix
David.
@funkheld Data structures [struct] could be used for this.
http://www.pd-tutorial.com/english/ch05s02.html#chapt5.2.3
@ingox But not very easily..... which is why I didn't go there!......
Where the OP is uncertain about arrays I try not to dig them too deep a hole.
It's very worthwhile learning about Data Structures..... but probably the most difficult thing to understand in Pd! There was even (one-sided) debate about dropping the documentation........

If the OP is interested then this is the best "entry level tutorial" that I have found......
tut-scalars.zip
David.
@whale-av You are right. I was just teasing, in case there would be any interest in the topic. And to make the thread more comprehensive for future visitors. 
hello all , thanks for help.
greeting
Hello, how can i please x and y with a hregler and a vregler change?
Plot tab 27 2 x y 2
thanks
greeting
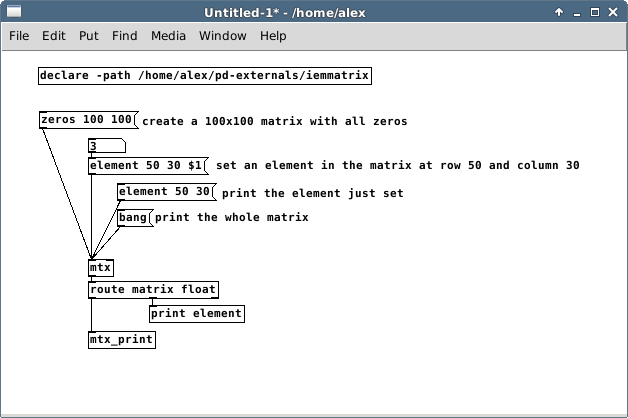
Since what you need is indeed a matrix, I guess [mtx] from the iemmatrix library would be the best solution. The image below shows a basic use of [mtx]:
Hello, good evening.
In the folder everything is in it:
D: \ purr-data \ extra \ iemmatrix
It does not work.
have :
Pd-l2ork-2.1.2-windows-i686
Thank you.
greeting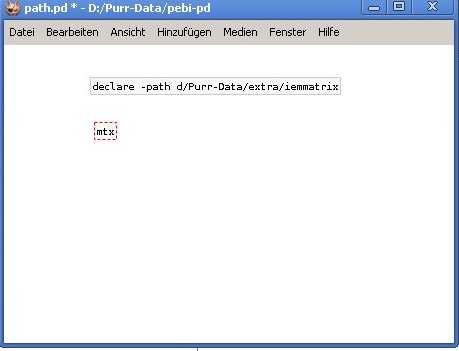
@funkheld you are declaring a relative to your patch path, I think it should be -stdpath, which is relative to Pd
hello, good day.
this not funktion.
thanks
greeting
On purr-data I did [declare -lib iemmatrix] and then put a [matrix] object instead, not a [mtx] and it worked. Try it.
Though I tried the same patch in purr-data and it doesn't work the same way it does on vanilla. don't really know why, I'm not using purr-data anyway.
if you have:
working directory is C:\Program Files (x86)\Purr Data (in my case)
or
working directory is d:\Purr-Data (maybe in your case)
in the console window
then [declare -path extra/iemmatrix should work
I also noticed you have a colon missing after the drive letter d in your screenshot
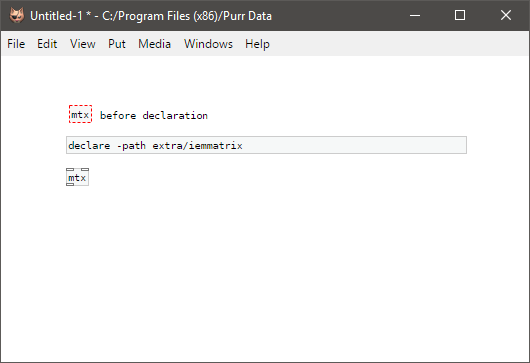
hello thanks.
is ok.
greeting
Hi good afternoon.
At bild2.jpg it works.
When I save it once path.pd and reload with path.pd comes
t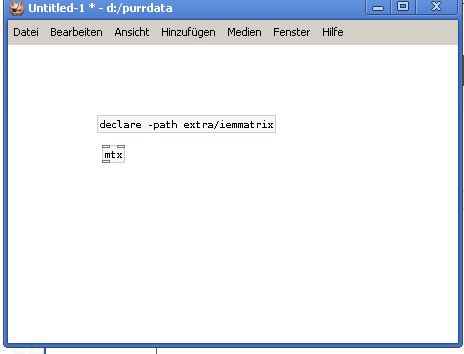 he error again bild3.jpg
Thank you.
greeting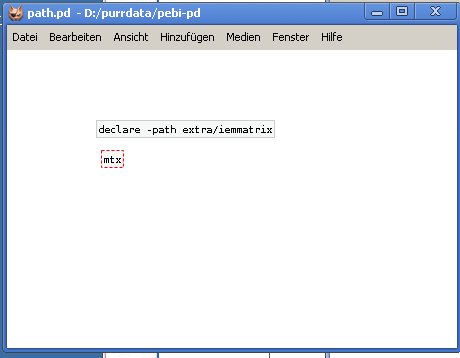
Hello, have found the error.
It entered in the search path.
greeting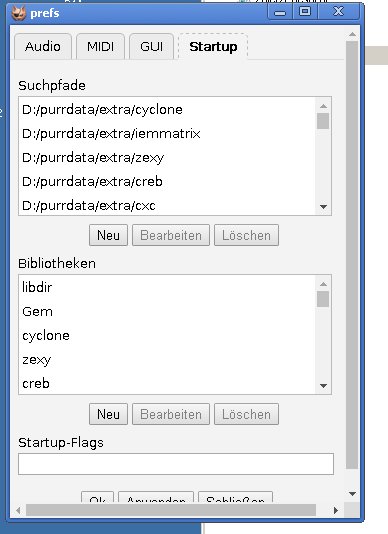
Oops! Looks like something went wrong!