Hi! I'm playing with electronic circuits simulation (with LTSpice IV) and can get interesting curves like this one.
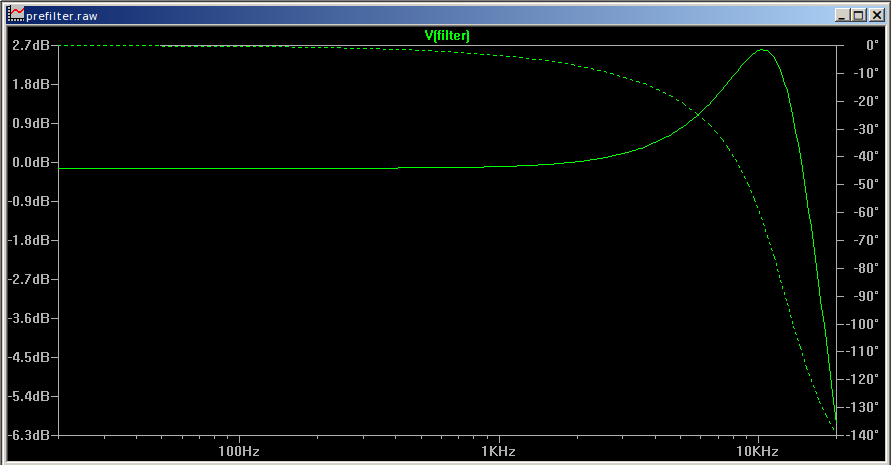
I of course also get a csv file containing the numbers that are used to display this curve.
Is there a simple way to deduce biquad filter parameters from that? 
-
Generating biquad filter parameters from a response curve?
-
This kind of curve look A LOT like a resonant low-pass (for which you can easily find biquad parameters).
-
Indeed it looks like one, the thing I'm missing is the method to get those parameters

How can I translate the peak frequency, gain @ peak frequency and slope into those parameters? -
@barbouze I think you will have to experiment to find the values......
The frequency should be the cut-off frequency, which, looking at your graph could be about 10kHz.
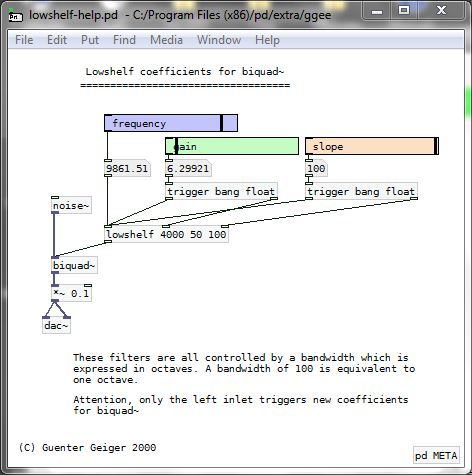
The gain is the relative level that you want to get to........ here it is maybe -6.3dB. But 50 as an input for [biquad~] is zero (flat) (in "equaliser" mode) so I would try about 43.4 and you might be lucky.
The slope is the dB per octave, but in [biquad~] it has a grain of 100 (100=1 octave)....... so it looks as though the slope is about 100........ it should get to -6.3dB in one octave (10kHz doubled = 20kHz).
So I would say to use the high-shelf settings........ but high-shelf and low-shelf only have positive gain if I remember correctly (I am almost certain that I must be wrong about that!!!!!!!).
So (if I am correct) you will have to use low-shelf and then correct for the added gain automatically in your patch.
This might help.......4band.pd
David.
-
Thanks for the help! I'll try that way, it's seems quite easy.

One last question, let's say that the signal goes trough multiple filters (one low pass and then 2 high pass with different settings). Is it possible to generate a curve by sweeping a sine from 20Hz to 20kHz and apply that curve as a filter in the same way you can use impulse response for reverbs? -
@barbouze Yes, you could plot amplitude against time for the duration of the sweep using [tabwrite~]....
Or you could use this free software.......... http://www.roomeqwizard.com/
David. -
I mean I can already plot the curve, I was just asking if there was a way to apply the frequency response described by that curve to the signal.

-
Take a look at example 3.8.2.1 on Johannes Kreidler's site:
http://pd-tutorial.com/english/ch03s08.html
Is that what you're after?
-
Yes! Thanks a lot!


