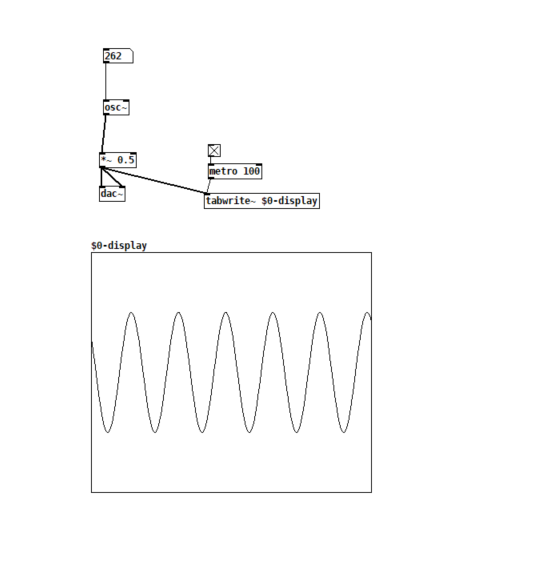
The question is as shown in the title. Thank you in advance for your answer! :)
How could I know the length of time represented in the waveform graph?

The question is as shown in the title. Thank you in advance for your answer! :)
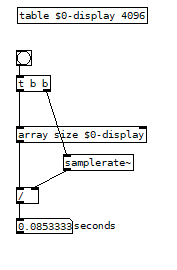
You divide the array size by the samplerate to get the number of seconds

@Balwyn Thank you so much. That's a really clear answer. I get it now!
@miyu I agree with @Balwyn, but if you just need a rough estimate, your thinking could have gone like this:
And at 44100 samples/second, that's approx 993 samples. Gosh, so close to 1000, I'd bet that table holds 1000 samples.
@jameslo It's an accurate and useful estimation method, thanks a lot!
Oops! Looks like something went wrong!