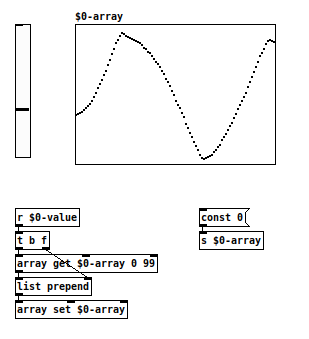
Hi, I'm trying to find a way to create a "rolling" graph of sensor visualisation. Using the tabwrite I can't seem to get anywhere as the number of datapoint to visualise as well as the frequency does not seem to render. Also, it does not provide any rolling from right to left. Any pointers if such patch would be easy to create or if sub-patch already exists for similar application ? I tried to look for LFO or envelopes viz but did not get anywhere.
-
Slow evolving value graph ?
-
-
From right to left: rolling_array.pd


